The most effective skills frameworks don’t just measure talent. They create a shared language for growth that aligns designers, managers, and partners around the future of design.
When leading a large design organization, one of the biggest challenges is ensuring every designer (regardless of discipline) has a clear path for growth.
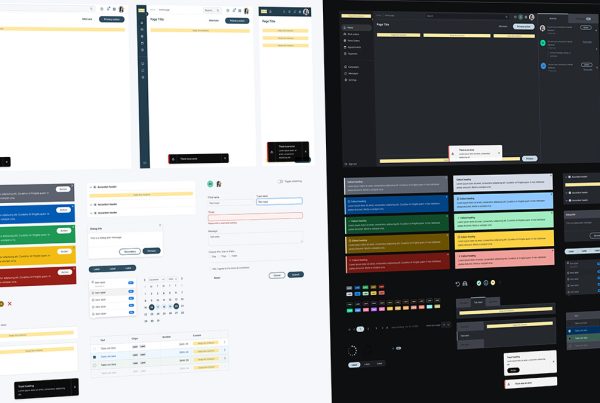
At RBC Digital, I had the opportunity to design and implement a Designer Skills Assessment Framework for a team of more than 120 professionals, spanning interaction designers, visual designers, content designers, design researchers, and product design leads.
This case study shares how we defined key capabilities, leveraged spider graph visualizations to bring assessments to life, and built a multi-perspective evaluation process that supported both individual development and organizational strategy.
Defining the key capabilities
The first step was to establish a shared language of capabilities across disciplines. Without clarity, evaluations risk becoming subjective.
We conducted workshops with leads from each discipline to identify what “great” looked like in their area, while also surfacing common threads across all design roles. The result was a structured set of capability categories:
-
Craft Excellence — mastery of core discipline skills (e.g., interaction design patterns, visual design systems, content clarity, research rigor).
-
Collaboration & Influence — ability to work cross-functionally, facilitate workshops, and communicate design intent.
-
Problem-Solving & Strategy — skills in framing challenges, applying systems thinking, and shaping product direction.
-
Leadership & Growth — mentoring peers, making design decisions, and contributing to design culture.
Each capability was paired with clear progression levels (from foundational → proficient → expert), giving designers a transparent growth roadmap.
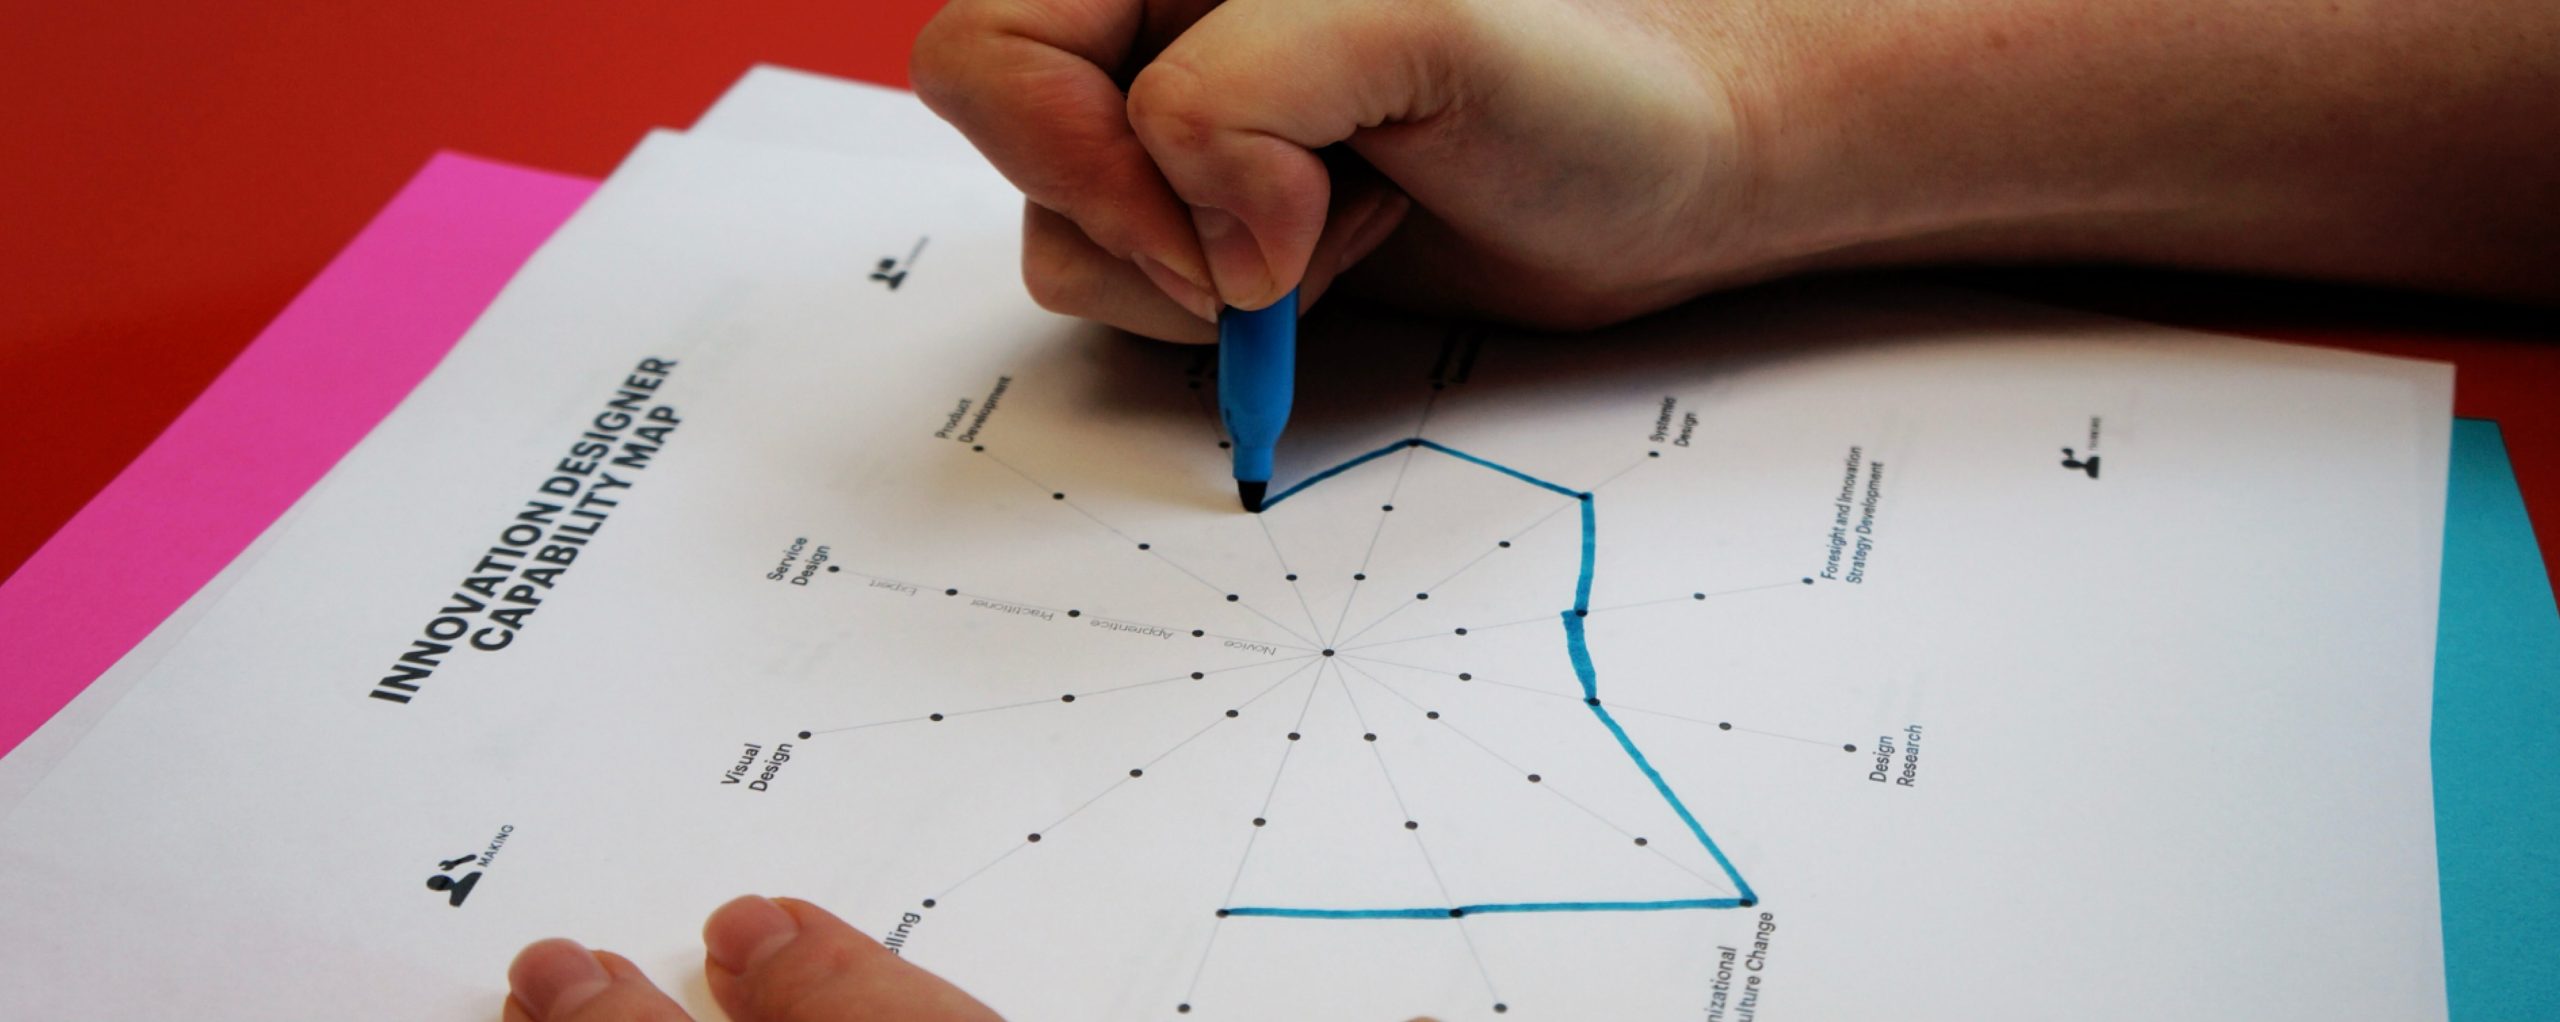
Visualizing skills with spider graphs
To make the assessment results actionable, we turned to spider graphs (radar charts). Each axis of the graph represented a capability, creating a visual snapshot of a designer’s strengths and growth areas.
-
Extended axes highlighted areas of strength.
-
Shorter axes revealed where to focus development.
-
Overlaying multiple profiles (e.g., across a team) gave managers a view of collective strengths and gaps.
The spider graph shifted the framework from being a static checklist into a conversation tool. One that made growth discussions concrete, visual, and easy to interpret.
Building a multi-perspective evaluation process
A strong framework needed to move beyond self-perception. To get a balanced picture, we designed a three-perspective evaluation approach:
-
Self-Evaluation
-
Each designer rated themselves, encouraging reflection and ownership of growth.
-
-
Manager Evaluation
-
Design managers assessed team members against the same capability framework, providing calibration and consistency.
-
-
Cross-Functional Evaluation
-
Product managers, engineers, and other stakeholders evaluated designers on collaboration, communication, and impact.
-
This added an outside-in perspective — especially valuable in a multidisciplinary environment.
-
By combining these perspectives, the framework offered both personal insight and organizational credibility.
Outcomes and impact
Implementing the Designer Skills Assessment Framework created a ripple effect across the design org:
-
For Designers — Clarity on growth expectations and visibility into development opportunities.
-
For Managers — A structured tool to support coaching, feedback, and team development planning.
-
For Leadership — Insights into organizational strengths and gaps, helping shape hiring and training strategies.
-
For Cross-Functional Partners — Greater transparency into design’s contributions and growth areas.
Most importantly, the process fostered a culture of continuous growth — shifting the perception of evaluation from judgment to empowerment.
Lessons learned
-
Simplicity drives adoption. A concise set of capabilities with clear levels was far more effective than complex rubrics.
-
Visualization builds engagement. The spider graphs made results intuitive and sparked richer growth conversations.
-
Multiple perspectives matter. Self, manager, and cross-functional views together provided balance and reduced bias.
-
Frameworks must evolve. As design practices grow, so should the assessment criteria — continuous iteration is key.
Conclusion
At RBC Digital, the Designer Skills Assessment Framework became a foundational tool for scaling a diverse design organization. By combining capability definition, visual storytelling through spider graphs, and a multi-perspective evaluation process, we empowered 120+ designers to take ownership of their growth while giving leaders actionable insights for organizational strategy.